Measure Your Composting Progress and Rally Your Community with the Diversion Dashboard
Our state-of-the-art Diversion Dashboard helps you track all of your composting milestones.
At Moonshot Compost, one of our core values is transparency - individuals should be provided with accurate and up-to-date data about the food waste they are diverting from landfills. That’s why we developed our proprietary Diversion Dashboard software.
We weigh every collection that we make, putting that data into the Diversion Dashboard, which then allows every Moonshot subscriber to see the impact they are having.
What Is the Diversion Dashboard?
The Diversion Dashboard is a personalized online tool available to all our subscribers.
We calculate the data we gather from your composting contributions by weighing the food waste that is collected and diverted from landfills (drop-off customers have the option to weigh their own contributions).
Our drivers measure and input the weight upon collection, and your Dashboard updates with the latest numbers on the same day.
With our Diversion Dashboard, subscribers are able to:
Access their data
at any time
via our website
View their landfill
diversion totals
Translate their impact
into other green equivalents,
such as number of
trees planted
Compare their community’s impact with those of other nearby communities
Share their contributions
to social media
The same data that powers the Diversion Dashboard also powers the Mooniverse,
an interactive map that contains total diversions for all Moonshot subscribers.
“We have always believed that you can’t change what you can’t measure.”
Chris Wood
Moonshot Compost Co-Founder
What Data Is Included?
Pounds of food waste diverted from landfills
Green equivalent in pounds of carbon dioxide
(CO2) saved
Green equivalent in miles not driven
Green equivalent in number of trees planted
Composting totals of your community and comparison with other nearby communities
The dashboard can also easily be shared to Facebook, X, and LinkedIn.
This Is What the Diversion Dashboard Looks Like
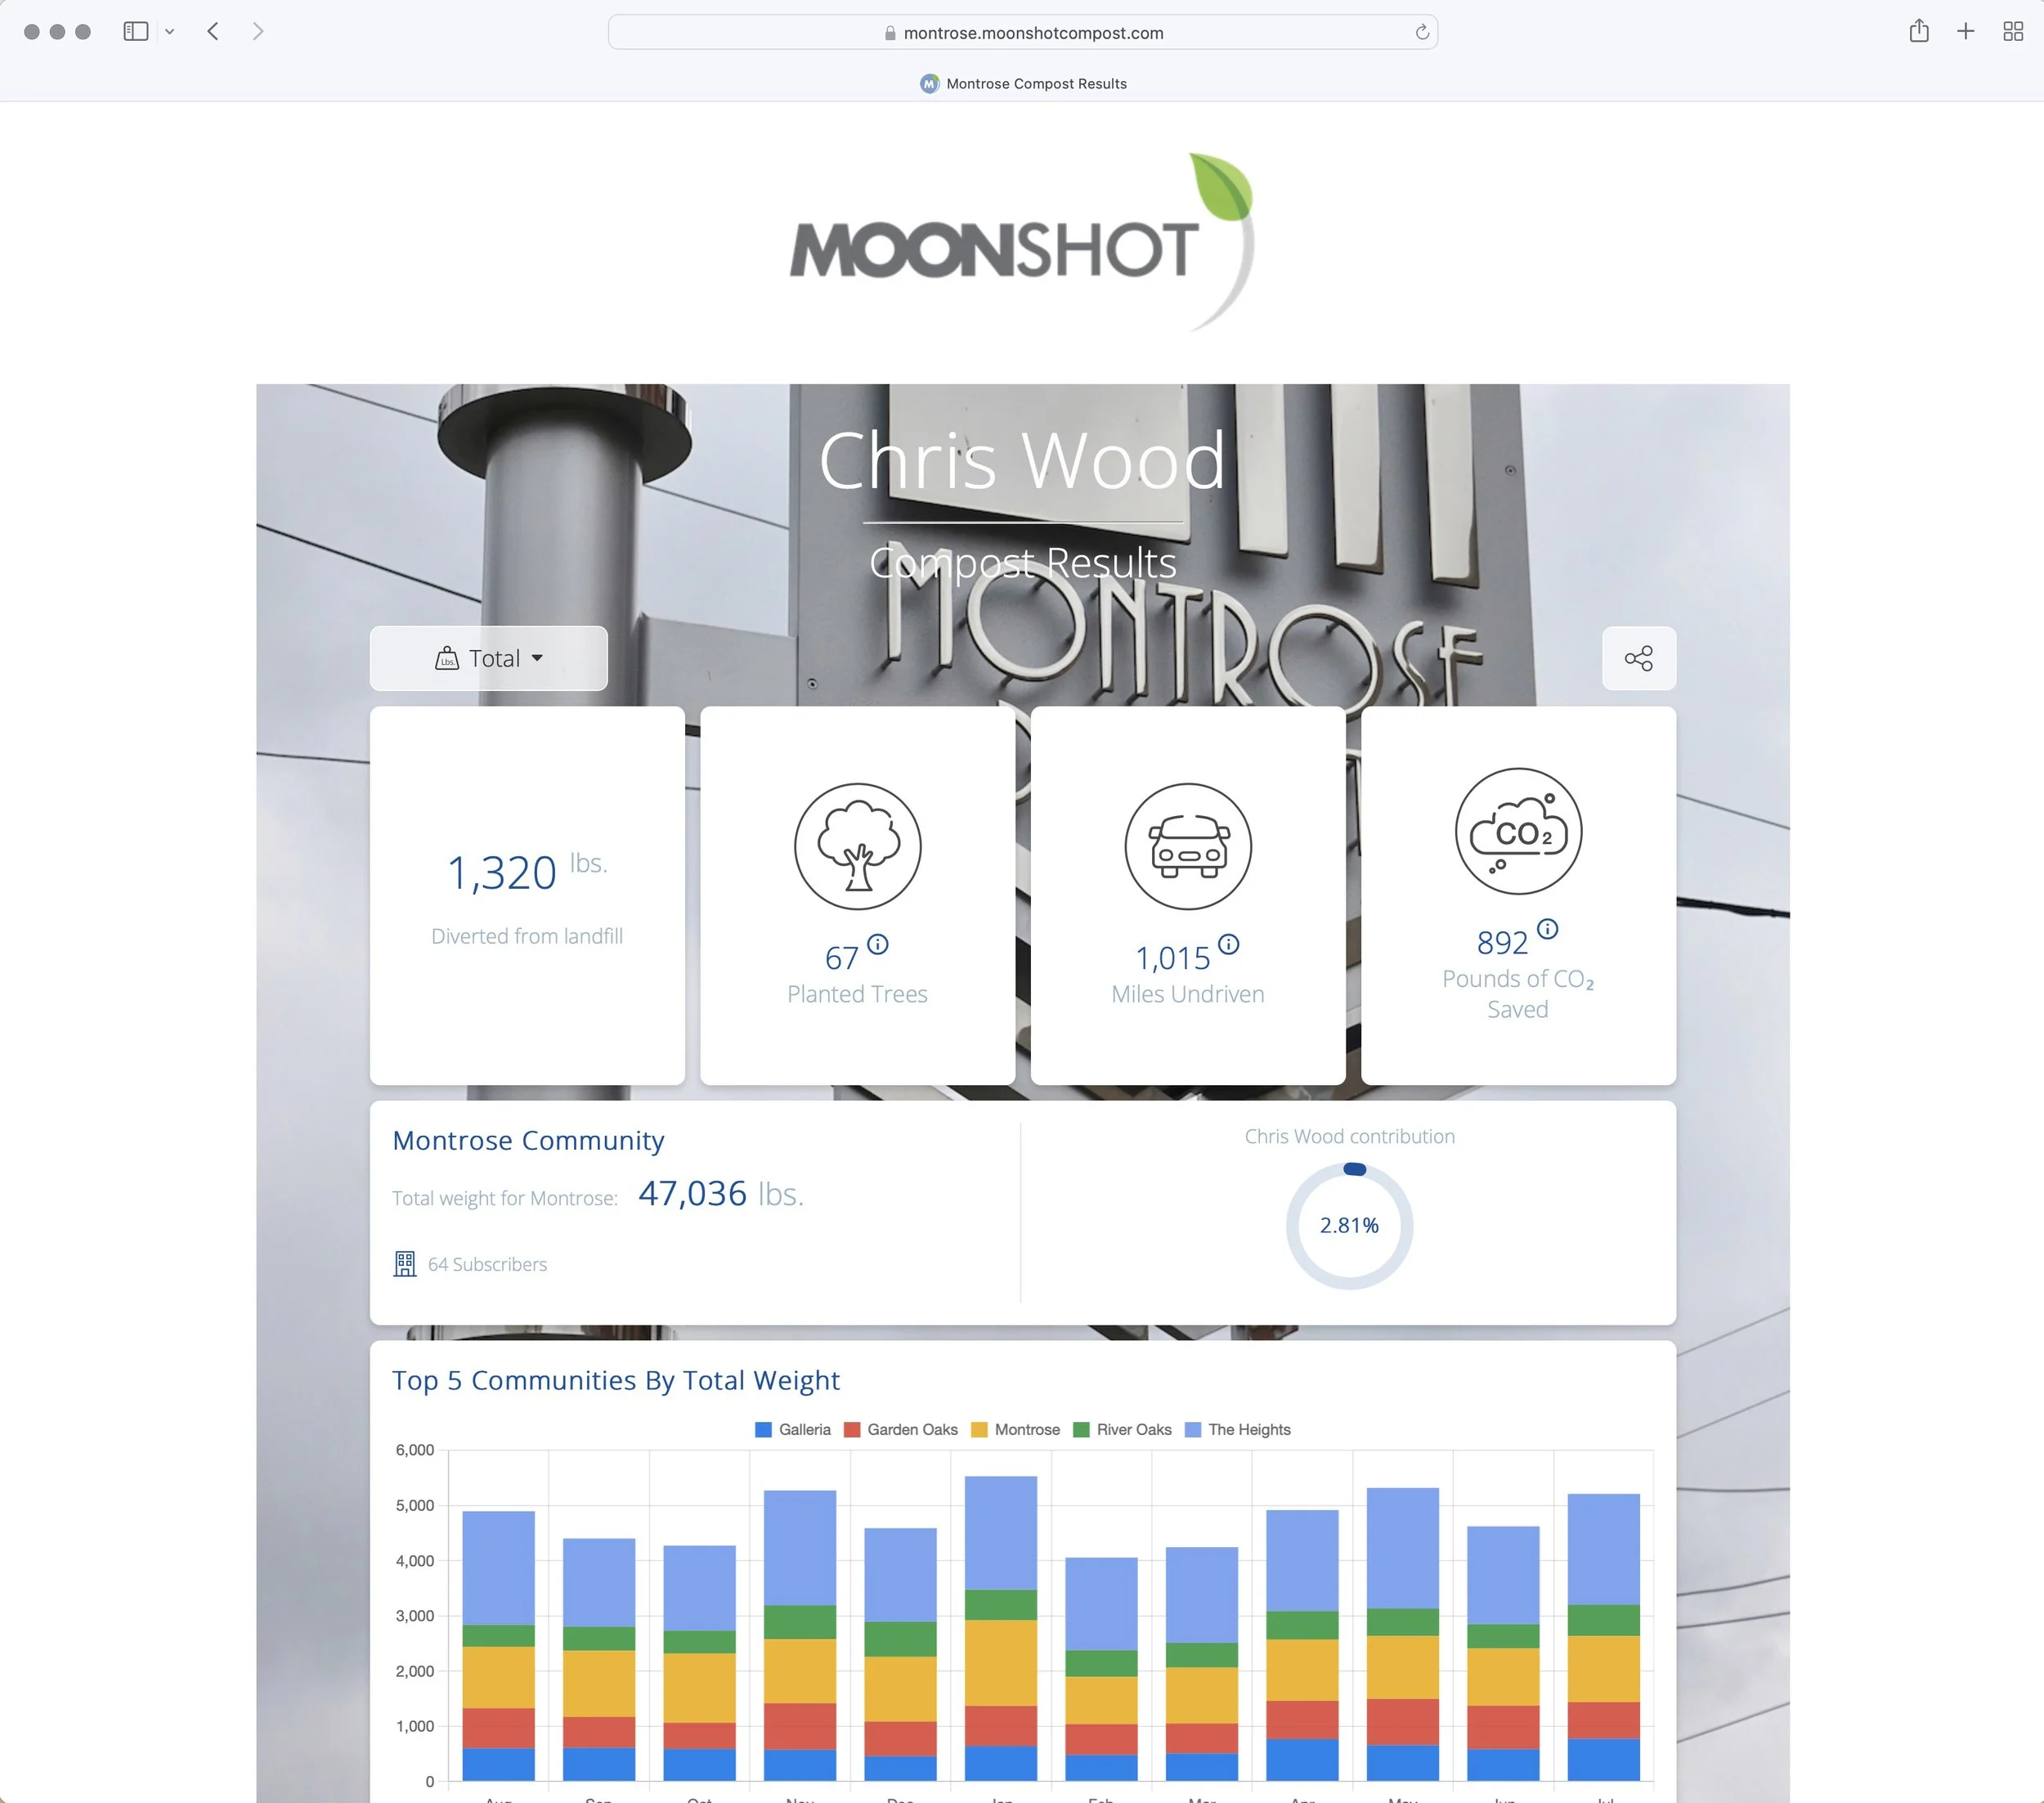
Here’s the Diversion Dashboard of Moonshot co-founder Chris Wood:
Scan the QR code or click the link:
Residential Diversion Dashboard example
View totals for all subscribers in Houston.
Scan the QR code or click the link:
Houston Diversion Dashboard
Using the Diversion Dashboard Is Easy!
See How Our Diversion Dashboard Works
Part 1: How to access your Diversion Dashboard
Watch your mail - We will send you a sticker with a personalized QR code.
Scan the code - Using your mobile device, scan the code to access the URL to your personalized Diversion Dashboard.
Pro Tip - These stickers are durable and scratch proof, so save it and stick it somewhere you can easily access it again (such as on your refrigerator door or inside a cabinet). You can also save the URL - in a note taking app, your browser bookmarks, or even with pen and paper.
Part 2: How to use your Diversion Dashboard
All in one place - All the information in your Dashboard is on one page.
Personal data - All of your personal data is displayed on the top row, which includes:
Weight - the first metric you can see is the weight in lbs. that you have diverted from landfills.
Green equivalents - 3 carbon equivalencies are listed for the impact of your diverted food waste: comparisons to the relative impact of trees planted, miles un-driven, and lbs. of CO2 removed from the atmosphere.
Broad data - Below personal data is a section for your broader data, including a community data section, which shows:
Weight - how much your community has diverted in total.
Subscribers - how many subscribers are in your community.
Personal percentage - your personal contribution to your community’s composting.
Community rankings - a list of local communities that have diverted the most, trending by month and 12 month totals.
What Can You Do With All This Information?
With our enhanced reporting you can:
Rally your community about the benefits of composting.
Share your data on social media.
Be inspired to keep composting.
Benchmark and set goals.
“The Diversion Dashboard can help subscribers understand how integral their actions are to creating a culture change around food waste diversion.”
Joe Villa
Moonshot Compost Co-Founder
Diversion Dashboard FAQs
-
The Dashboard is free for all residential subscribers.
-
Everyone has a dashboard created. For pickup subscribers, your collection will always be weighed. You can choose to access the dashboard or not but it will always be there should you want to see it. Drop-off subscribers can choose to weigh and record their weight when dropping off.
-
Send an email to info@moonshotcompost.com.
-
When drivers pick up the compost, they weigh it immediately to ensure the data is accurate so you will be able to see same-day data.
-
Yes! When you take your waste to one of our drop-off locations you can choose to weigh your food waste onsite and then enter your weight via your Moonshot account on our website. Each drop-off location has simple instructions for Moonshot subscribers to follow.
Start Your Composting Contributions Today
Moonshot Compost makes composting easy.
We supply you with collection bins, signs on what can and can’t be collected, clean bins on every collection day - all this along with our Diversion Dashboard technology to keep you informed on the impact you are having.


